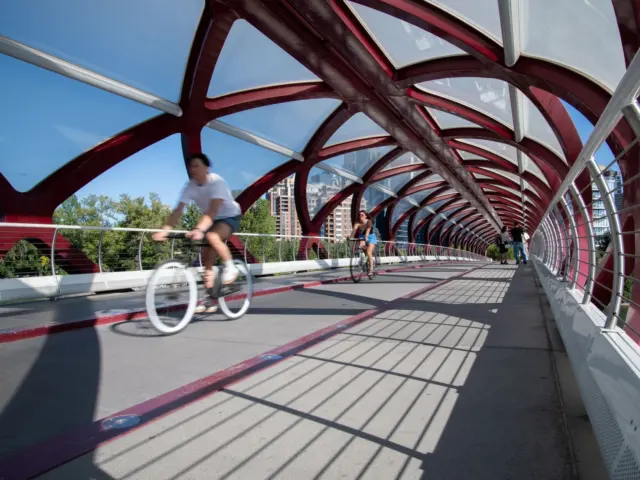
Calgary weather makes May to September your main outdoor skate window. Look for dry concrete; a winter chinook alone will not deliver it.
That window comes from historical temperatures, not an official skate season; check the surface before putting your board down. The Calgary trip-planning hub connects that weather decision with parks, transport and other outdoor options.
Calgary weather at a glance: historical normals
Calgary’s airport normals show warm summer afternoons, cold winter nights and snow extending into spring and autumn. The figures below are Environment and Climate Change Canada’s 1981–2010 normals for Calgary Int’l A, not a forecast or a newer climate period.
| Month | Mean daily maximum | Mean daily minimum | Precipitation | Snowfall |
|---|---|---|---|---|
| January | −0.9 °C | −13.2 °C | 9.4 mm | 15.3 cm |
| March | 4.4 °C | −7.5 °C | 17.8 mm | 22.7 cm |
| April | 11.2 °C | −2.0 °C | 25.2 mm | 18.8 cm |
| May | 16.3 °C | 3.1 °C | 56.8 mm | 11.9 cm |
| June | 19.8 °C | 7.5 °C | 94.0 mm | 0.1 cm |
| July | 23.1 °C | 9.8 °C | 65.5 mm | 0.0 cm |
| October | 11.7 °C | −1.4 °C | 15.3 mm | 10.0 cm |
| December | −0.8 °C | −12.8 °C | 10.2 mm | 15.0 cm |
Source: ECCC’s Calgary Int’l A climate-normal records, station 2205. Precipitation and snowfall are different measures with different units; do not add the snowfall centimetres to the precipitation millimetres.
Conditions and hours can change; check your destination’s official page and the current forecast before your visit. The station at Calgary International Airport provides a consistent reference for comparing months.
When is the most practical outdoor skate season?
May through September is a reasonable planning window for outdoor skating, with April and October as more conditional shoulder months. Those historical temperatures help you choose dates; they cannot promise dry concrete when you arrive.
In the 1981–2010 normals, May’s mean daily maximum is 16.3 °C, July’s is 23.1 °C and September’s is 17.8 °C. August sits at 22.8 °C. These figures make the warmer months a sensible place to begin if you can choose when to visit for outdoor sessions.
April and October have mean daily maxima of 11.2 °C and 11.7 °C respectively. Their mean daily minima are below freezing: −2.0 °C and −1.4 °C. For planning, that contrast is a reason to check more than the afternoon high and leave room to alter an early or late session.
Choose the date range first, then the location. The park-by-park Calgary skatepark comparison helps you select a destination once the seasonal window fits.
What chinooks can change in winter
Chinooks are warm, dry westerly winds descending the east side of the Rockies that can raise Calgary’s winter temperatures sharply.
In CBC’s explanation of Calgary chinooks, an ECCC meteorologist cites an estimate of about 25 chinook days during meteorological winter: December, January and February. The same explanation acknowledges the difficulty of separating a chinook precisely from another winter warm-up. Treat the number as a qualified estimate, not a recurring schedule.
The airport normals offer another useful comparison. January averages 2.7 days with a maximum above 10 °C, and February averages 4.0. Those counts tell you how often the air warmed up, not how often a park was ready to skate.
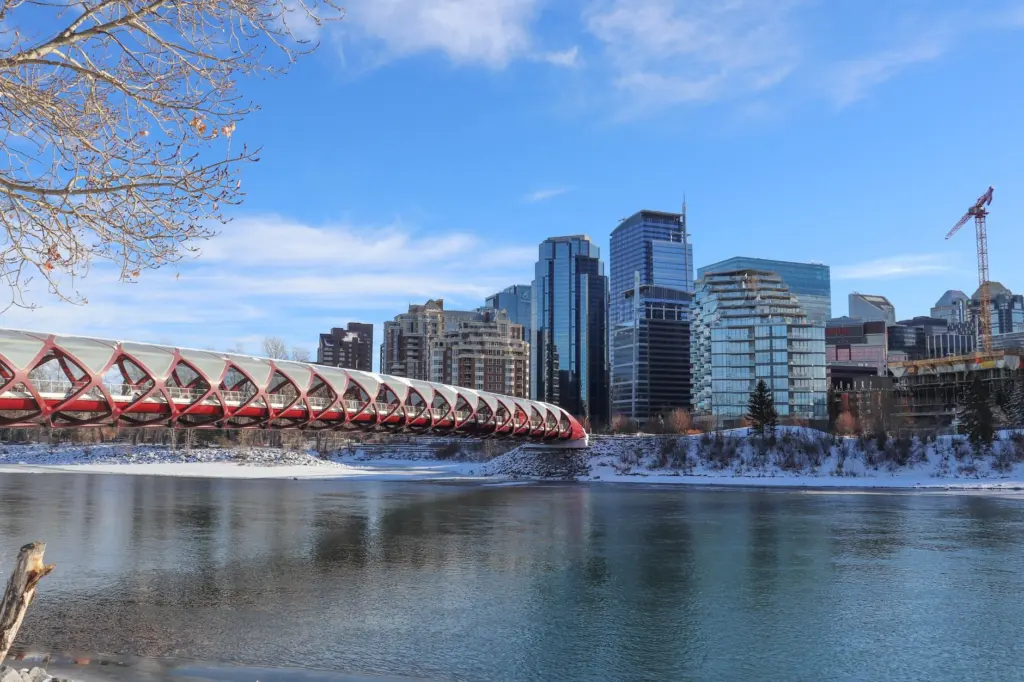
The winter photograph shows Peace Bridge and downtown Calgary. A clear-looking sky in an image cannot tell you the surface conditions you will encounter on another day, and the photograph is not evidence of skateboard access there.
Spring: warmer afternoons still come with snow
Pack for spring with snow still in mind. In the verified normals, March averages 22.7 cm of snowfall, April 18.8 cm and May 11.9 cm.
Choose your spring dates carefully: the month makes a difference when you are packing for outdoor skating. March’s mean daily maximum is 4.4 °C, compared with May’s 16.3 °C. Warmer afternoons still come with snowfall.
ECCC’s historical mean date of the last spring frost converts to about May 21, and the mean frost-free period is 117 days. These are long-term averages, not deadlines after which frost becomes impossible.
Summer: warm does not mean consistently dry
Summer offers the strongest temperature window, but June is the wettest month in the 1981–2010 airport normals. It averages 94.0 mm of precipitation, compared with 65.5 mm in July and 57.0 mm in August.
The same dataset records an average of 25.3 thunderstorm days a year. July has 8.1 and June 6.8; recorded hail days also peak in those months, at 1.33 and 1.23 respectively. These are historical station averages and are not probabilities for a particular hour or park.
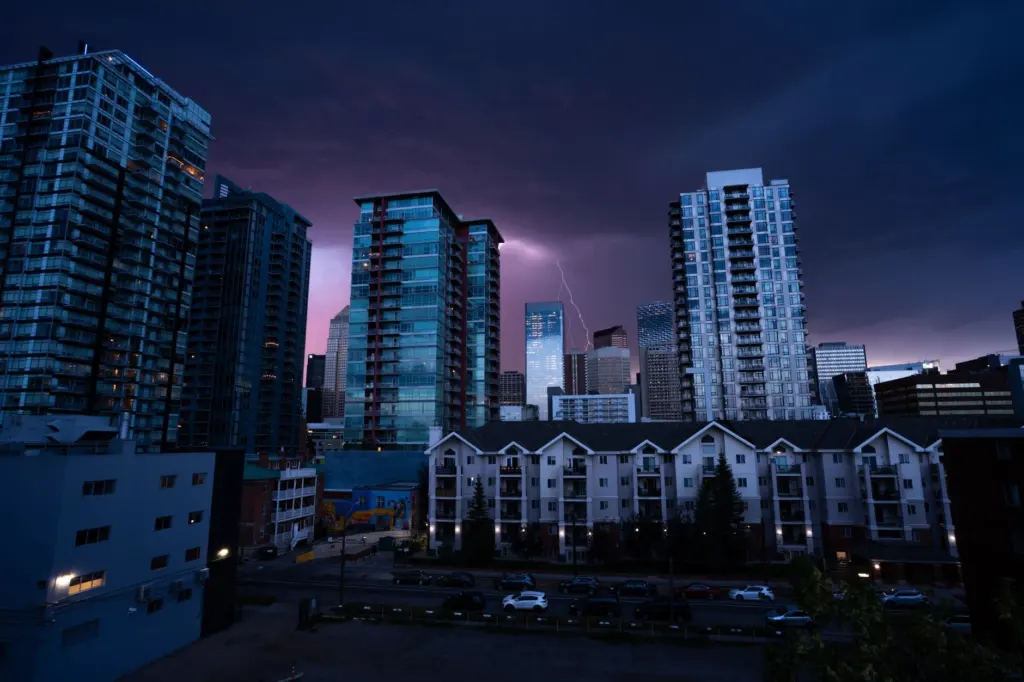
Choose somewhere to go if a storm interrupts your outdoor session, and share that plan with your group.
Autumn and winter: plan around the whole outing
Autumn and winter require more conditional outdoor plans because historical temperatures, snow cover and daylight all narrow the options. The temperature at the warmest point of the day is only one part of that decision.
September’s mean daily minimum is 4.1 °C, while October’s is −1.4 °C and November’s is −8.2 °C. The historical first autumn frost date converts to about September 16. As with the spring date, this is a long-term mean rather than a guarantee for any given year.
January averages 19 days with snow depth of at least 1 cm at the airport station, and December averages 17. The annual figure is 86 days. This is ground-cover data at a station, not a record of clearance at skateparks or on individual pathways.
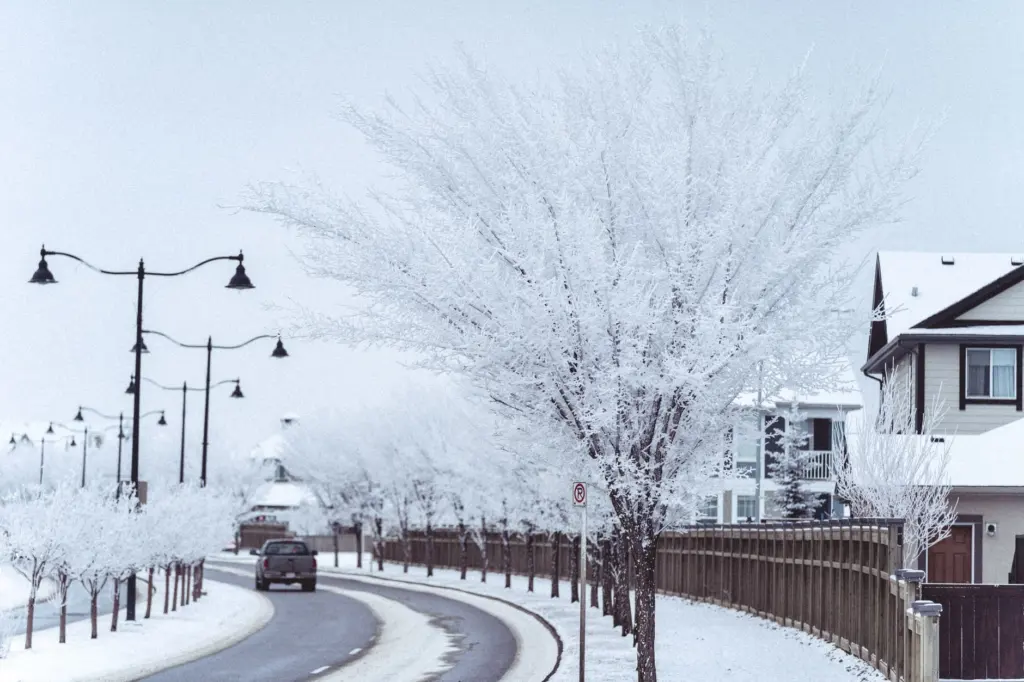
The Calgary winter skateboarding options include indoor sessions that do not depend on a winter warm-up.
Daylight and sunshine are different planning numbers
Daylight describes the time between sunrise and sunset; recorded bright sunshine measures something different. Use daylight to frame the outing and climate sunshine totals only as background.
The Calgary sunrise and sunset calendar lists 16 hours 33 minutes of daylight for June 21, 2026, and 7 hours 54 minutes for December 21, 2026. Those dated figures illustrate the seasonal difference without predicting the weather on either day.
ECCC’s 1981–2010 normals record 2,396 hours of bright sunshine annually. July’s figure is 314.1 hours and January’s 119.5. A sunny climate summary therefore does not mean you can schedule the same length of outdoor visit throughout the year.
Plan your departure, session and return within the daylight available on your chosen date.
Make a weather decision for your actual route
Use this sequence to turn your seasonal choice into a session plan.
- Choose the activity. Decide whether skating is essential or an optional part of an outdoor day.
- Check the full window. Consider the outward journey, session and return rather than only a single temperature.
- Inspect on arrival. Change the plan if the surface is unsuitable.
- Keep an alternative. Decide whether you will switch indoors, walk or return another time.
If your plan follows the rivers, the river pathway guide for route planning helps you choose a stretch and check access. Do not turn a warm forecast into an assumption that every pathway is suitable for skateboarding.
Before packing, review the protective gear guide for skateboard sessions alongside your session plan.
Frequently asked questions
What are the best months for outdoor skateboarding in Calgary?
Roughly May through September is a reasonable recommendation based on the verified historical temperatures. April and October can also offer opportunities, but this is an inference from climate data rather than an official skate season.
Does a chinook guarantee a dry skatepark?
No. A chinook can raise air temperatures, but the sources do not establish dry conditions at any particular skatepark.
How much snow does Calgary get?
Calgary Int’l A recorded average annual snowfall of 128.8 cm in the 1981–2010 normals. That is a historical station figure, not a forecast or a measure of how much snow remains at a particular park.
Which month is wettest in the verified climate table?
June is wettest, with 94.0 mm of average precipitation in the 1981–2010 airport normals.
Why use airport climate data for a city skating guide?
The airport record supplies a consistent series for comparing months when you choose your travel dates.
Sources
The climate figures use the verified 1981–2010 ECCC dataset; chinook frequency and dated daylight lengths come from the separate sources below.